Screen tour
layoutscreenpanestopic listresult controlresult viewmessage panelhelp
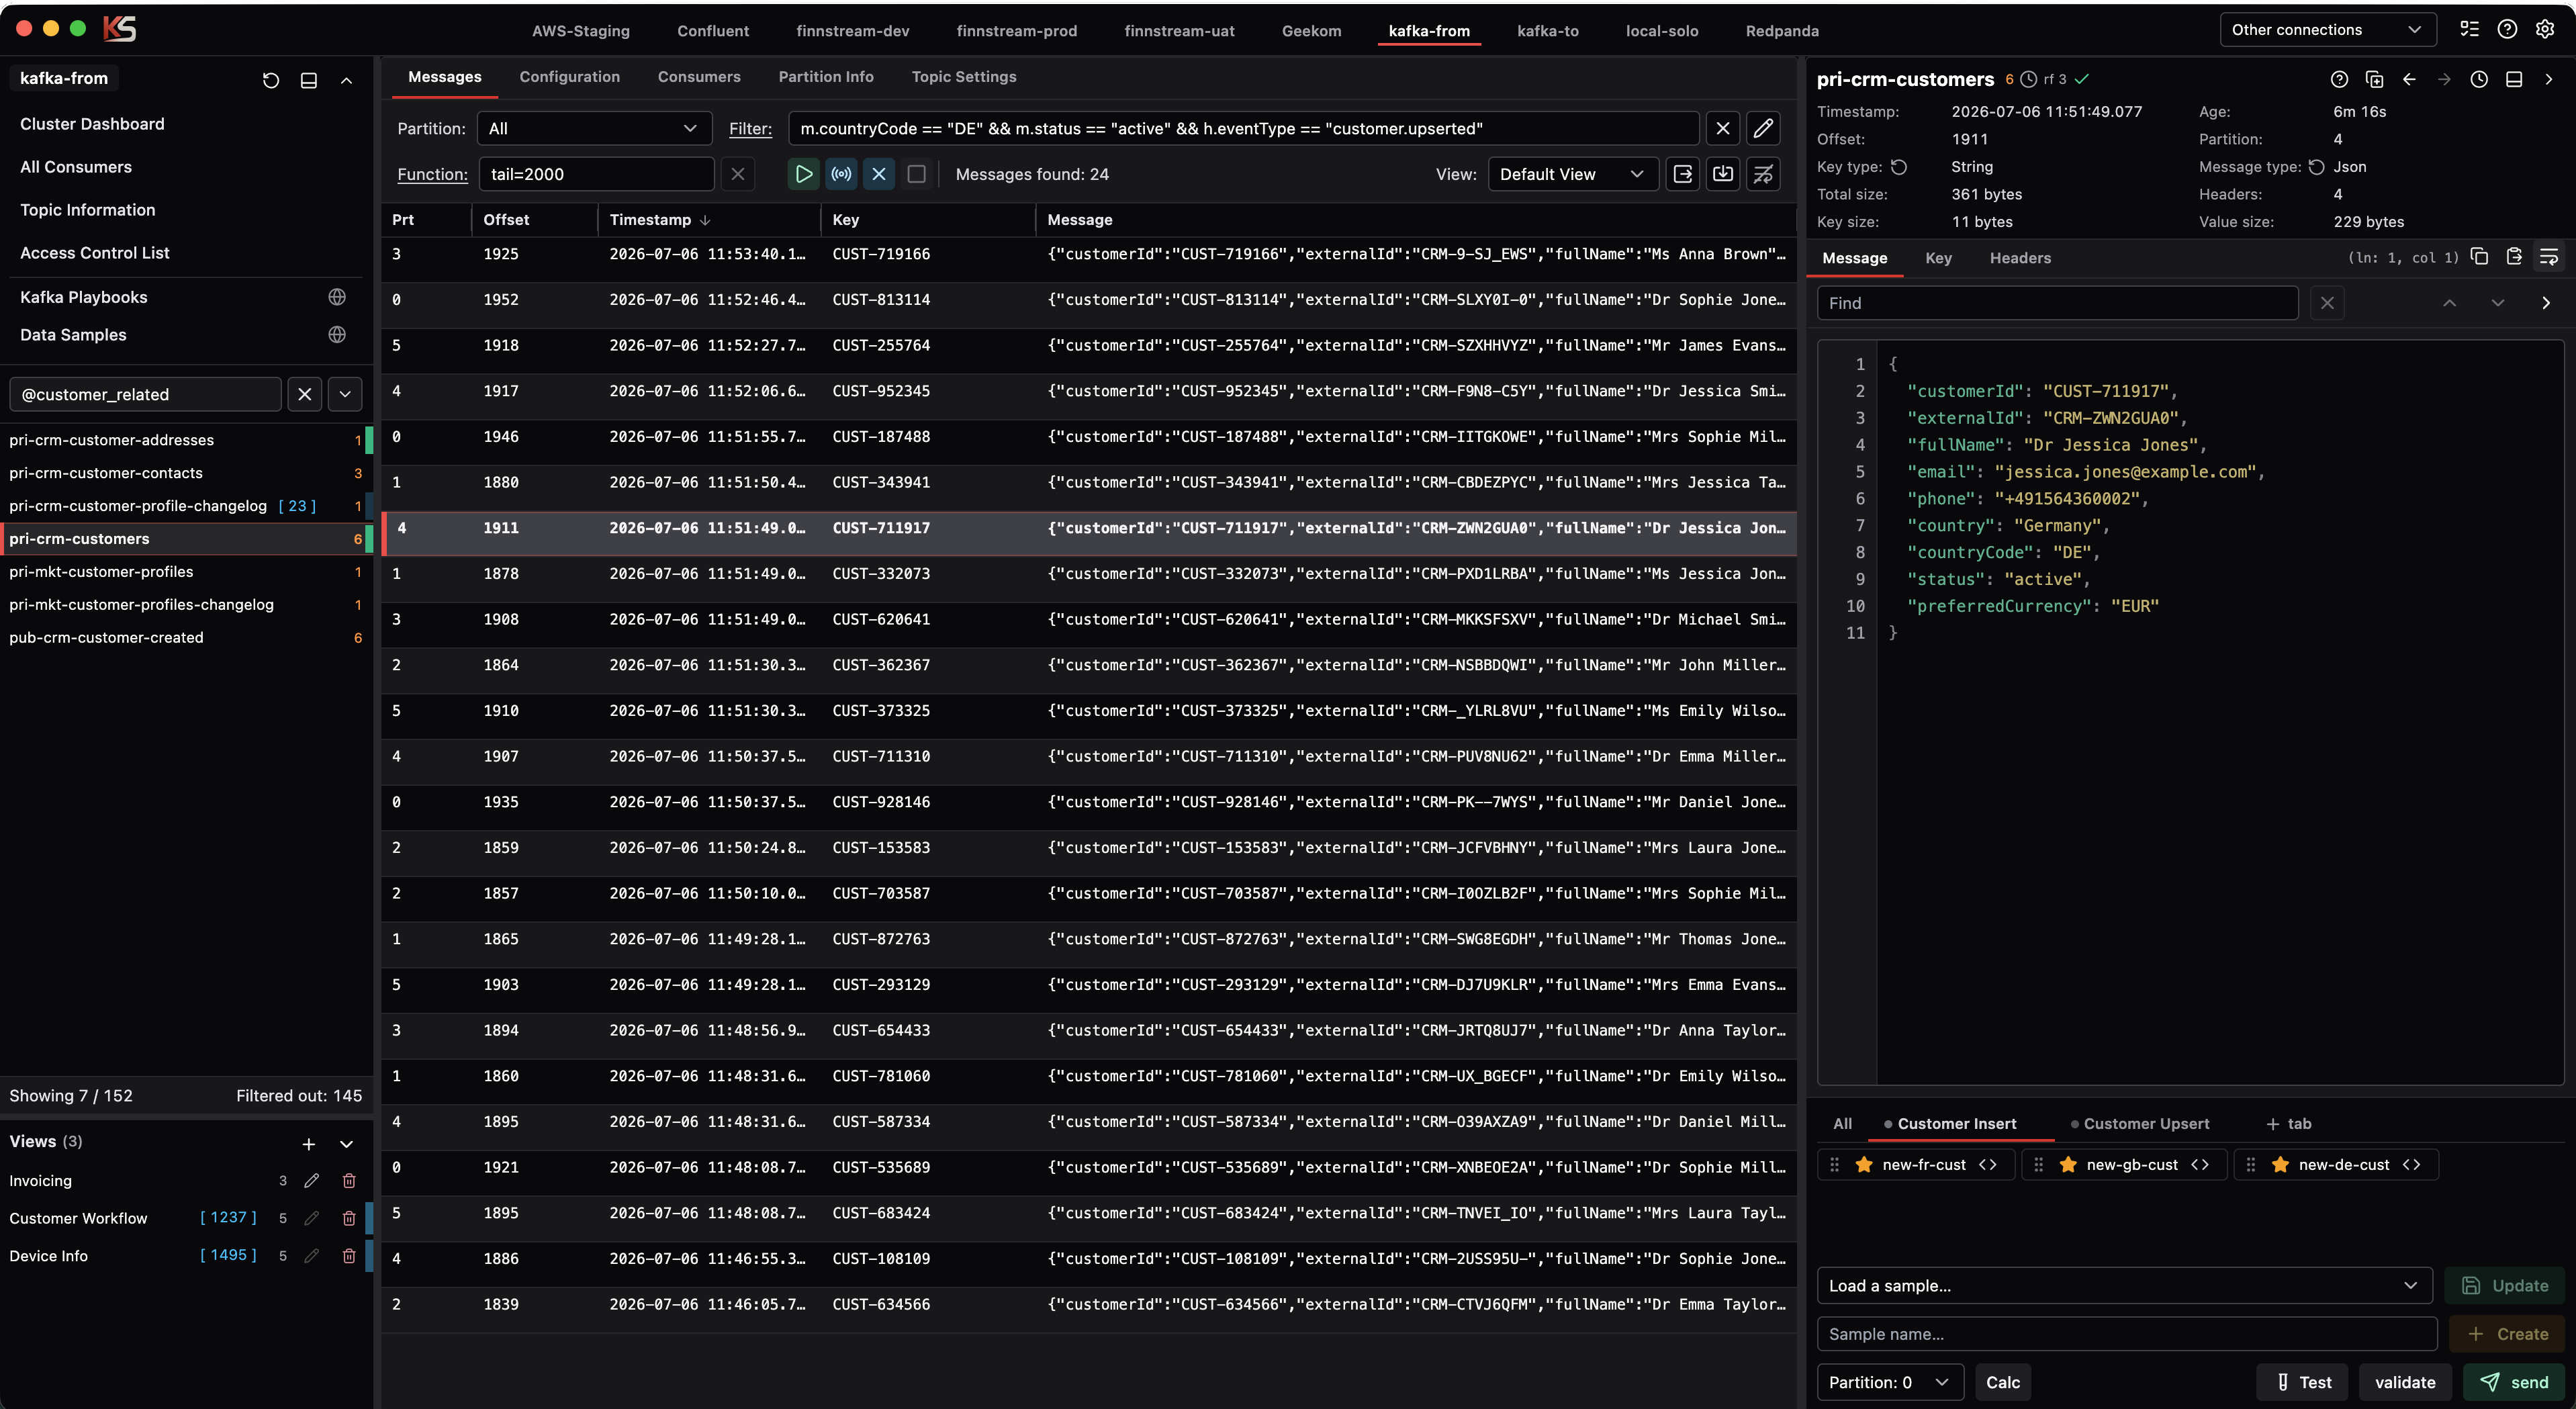
This is a guided tour of the main Kafka Streamyard screen, using focused screenshots of the main areas you work in most often.
Main screen
This is the main screen. It gives you the overall working layout with topic and navigation tools on the left, active working controls in the middle, and the message panel docked to the right.
In this example you can see a topic selected from the list, matching results returned to the UI, and the selected message opened in the details panel for inspection and testing.
Top-left navigation
At the top-left, the static navigation links provide quick access to tools such as
Cluster Dashboard, All Consumers, Topic Information and the important Playbooks and Data Samples - also will show Schema Registry editor when configured.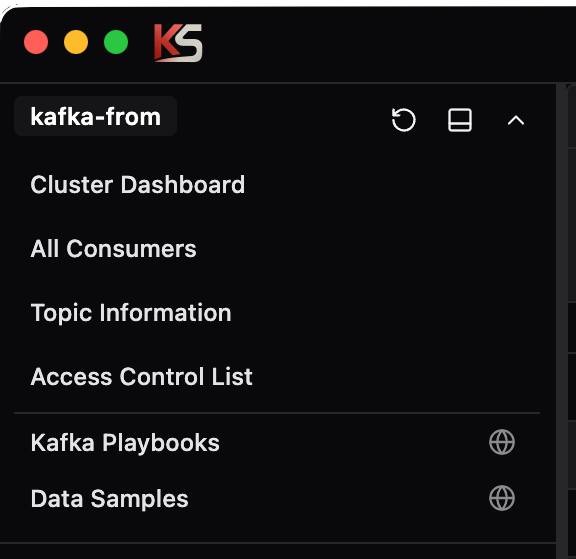
Quick connection bar
This is a quick connection access bar for your most used connections.
Hover over to pop-out an additional screen to the same connection, which is useful if you are doing lots of work and testing on the same connection, live view feeds showing on one screen and you send samples on the other against various topics.

Hover over to show popout clickable glyph
Icons & dropdown
This shows other connections which is for connections you don't use so often, a task icon to show running tasks like copy topic data, repartitioning, playbooks etc, the searchable help, and the settings / connection manager icon.

Topic list
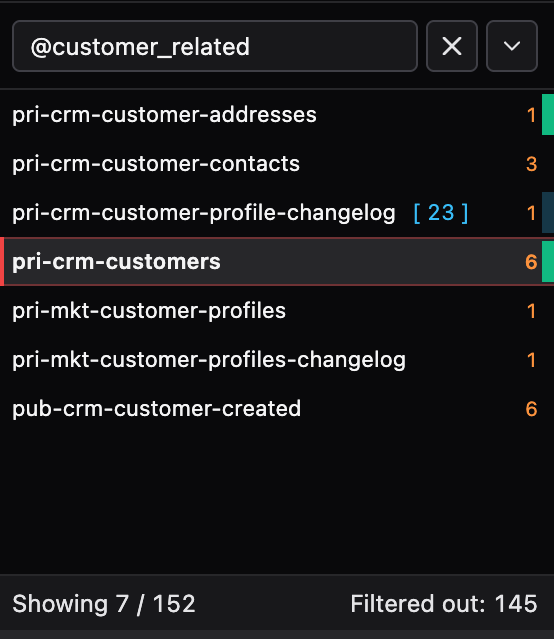
The topic list offers advanced saveable filters that are easily selectable.
Green tabs mean data has been searched and returned to UI and is persisted until cleared.
A blue flash tab shows data is in live feed mode and will show number returned in square brackets.
The number next to topic in orange is number of partitions.
Everything is asynchronous so you can find data on one topic and look for data on another and any will show when data results are returned with the green tab as the indicator.
At the bottom of the topic list shows the filtered vs total amount of topics on this connection.
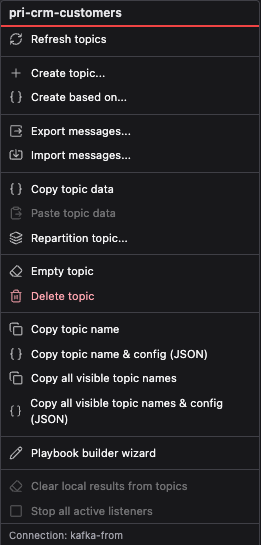
Topic list context menu
On the list is a context menu with many functions available directly from the selected topic.
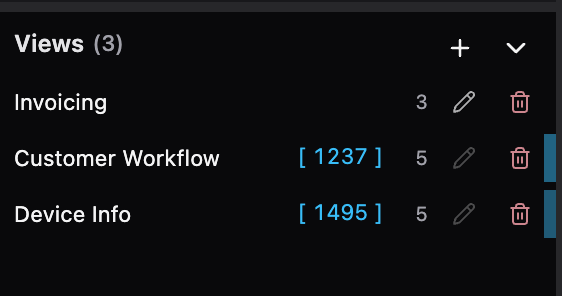
Views
Bottom left shows the Views these are live feeds of 1 or more related topics chronologically returned to the UI.
You can have 20 topics per view and can filter on each one individually using saved filters or immediately added filters.
Result controls and result list
At the top is partition selection, filter (press down key for history and pencil icon to save and select saved filters from any connection or topic).
The Offset function provides targeted functions to select from various offsets.
There is also a live feed button here:
Live feed.You can import or export data from this top area and even customize the result display to make it more user friendly which you can export then as CSV making it great to share with the business.
For filtering on a message with the aid of autocomplete,
m. means message, k. means key and h. means header, once the data is 'learnt', meaning you've played some messages back, autocomplete is available on key, value and header.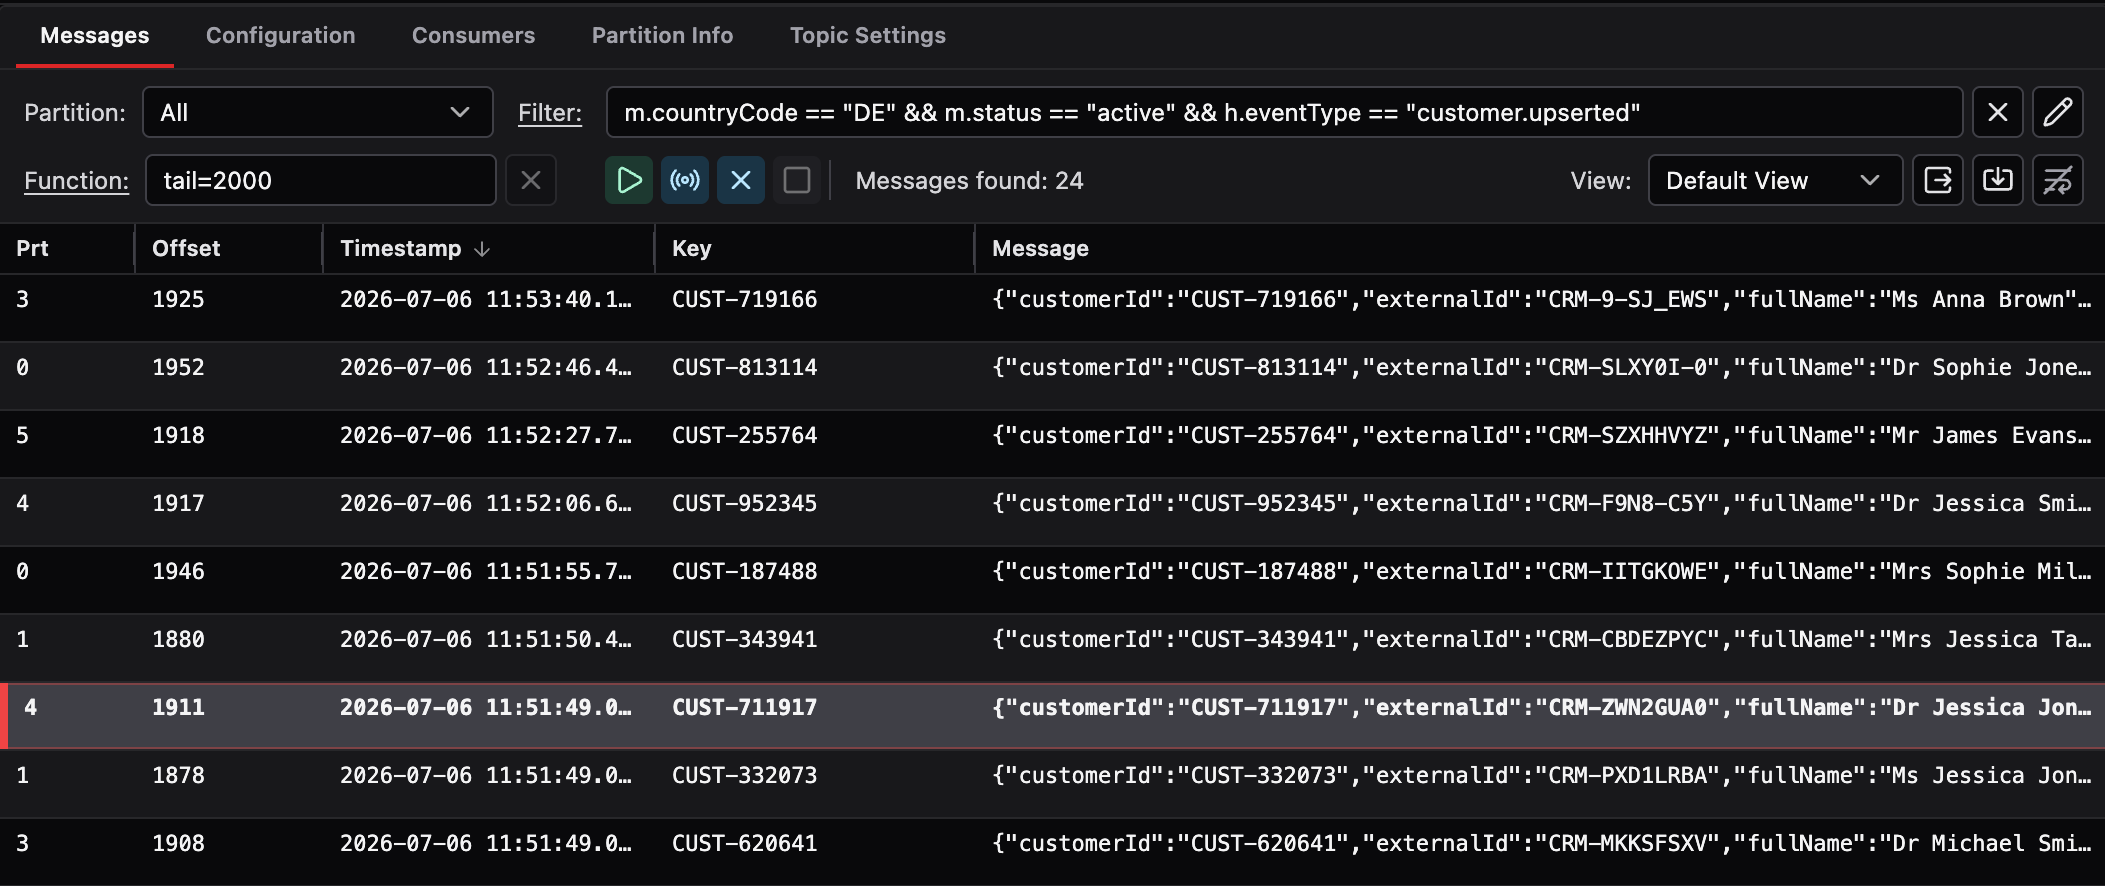
Message panel and samples
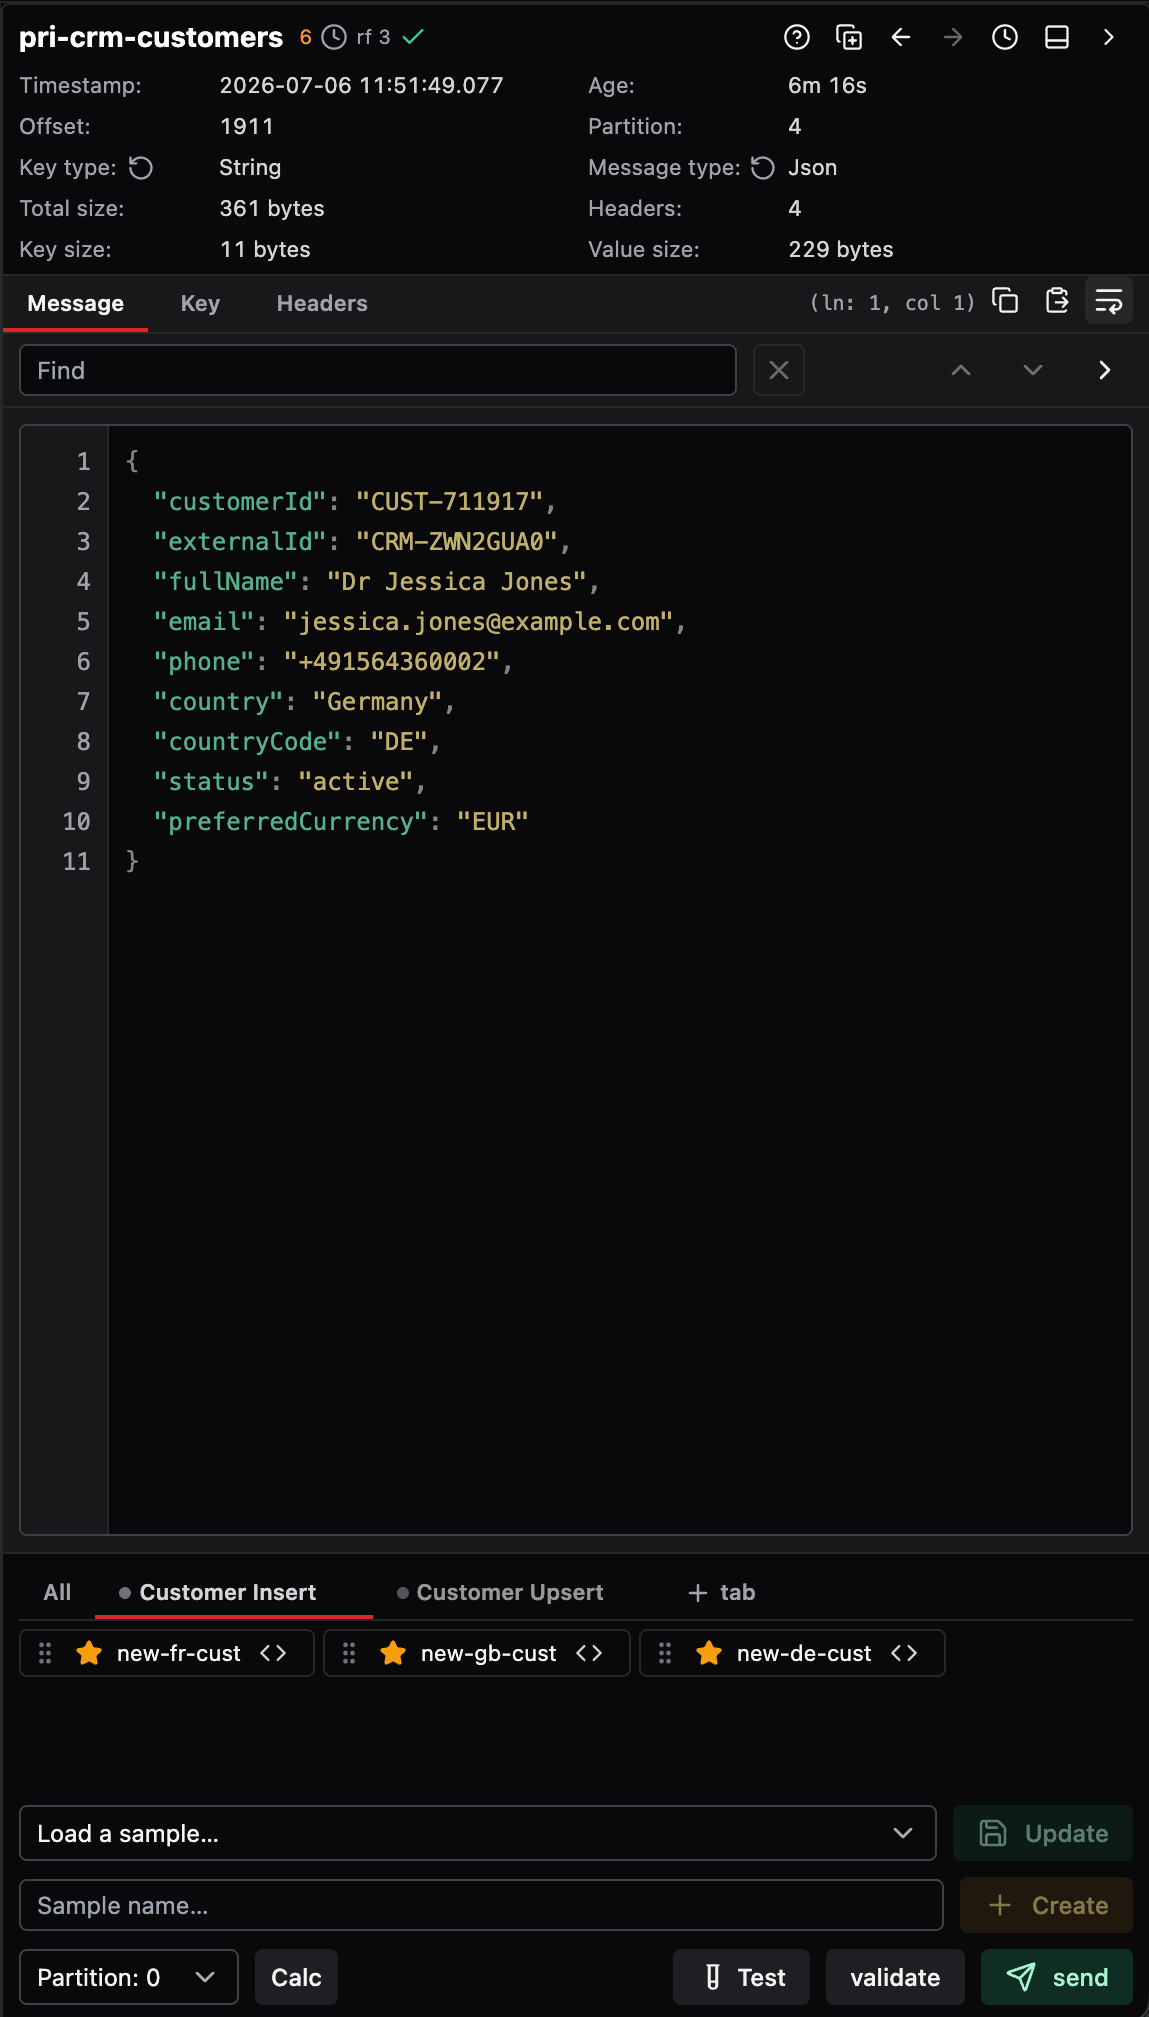
The all important message panel which can be docked right or bottom. Shows all the info about a topic and it's message, value key and header.
You can trace selected history here which is great when you want a message back but can't remember the offset.
You can copy and paste the whole message in KS json format (holds all the info about a message, partition, offset, timestamp, etc.) or individual parts of the message.
The stand out feature of KS is being able to send samples to the topic for manual testing. We'll do a blog post on this subject as this is one of the main drivers for creating this software.
You can see at the bottom you can have various sample data organised in folders and the order you might want to send them in.
You can also save samples directly here if you have a message that needs investigate and later replaying once a fix is in.
You can create templated messages and assign values automatically and is used in conjunction with Data Samples seen top left.